Session Playback and Skip Button Not Working
session-playback-and-skip-button-not-working-troubleshooting
June 11, 2026
What Happens If I Miss a Promotional Offer, and Are There Alternative Discounts Available?
what-happens-if-i-miss-a-promotional-offer-and-are-there-alternative-discounts-available
May 4, 2026
Go To Date Feature for viewing data on a specific day
go-to-date-feature
April 15, 2026
Is there an option to add TradingView indicators to FX Replay?
fx-replay-indicators
April 15, 2026
Exporting Reports for the Journal
support-fxreplay-com-articles-exporting-reports-for-the-journal
November 7, 2025
Troubleshooting
troubleshooting
November 7, 2025
Coexistence with Backtesting Journal
coexistence-with-backtesting-journal
November 7, 2025
Trading Accounts
trading-accounts
November 7, 2025
Analytics
analytics
November 7, 2025
Tag Analysis
tag-analysis
November 7, 2025
Live Trades
live-trades
November 7, 2025
Overview
Learn about the new FX Replay Journal — an intelligent trading journal that connects seamlessly with major platforms to analyze performance and optimize strategies.
overview
November 7, 2025
Prop Firm Simulator
FX Replay’s Prop Firm Simulator lets you set your firm’s rules—drawdown limits, profit targets, and more—and start testing under real challenge conditions. No replaying back in time if you missed a trade — just real data, real pressure, and real preparation to help you sharpen your edge and build confidence before taking the actual challenge.
prop-firm-simulator
November 5, 2025
How to Use Drawdown Analytics
Drawdown Analytics measure how much price moves against your position — in risk multiples (R) — before eventually closing in profit.This feature gives you deeper insight into your winning trades so you can evaluate risk, tighten entries, and refine trade management.In your Analytics Dashboard, you’ll see three key metrics that reveal how much “heat” your trades typically take before reaching their targets.
how-to-use-drawdown-analytics
August 21, 2025
How to Use Bar Replay / Right-Click Replay
Bar Replay allows you to jump back to any candle in your session — instantly.With the latest update, Replay Mode is now fully integrated into the chart UI in two ways:A dedicated Replay button in the Price Skipper barA Right-click on any candle → Replay to this pointThis gives you a seamless way to rewind, review, and reset your view to any part of your session — all without reloading or breaking your flow.
how-to-use-bar-replay---right-click-replay
August 21, 2025
How to Use Bar-by-Bar Rewind
Made a mistake or want to review price action? Bar-by-Bar Rewind lets you step backward one candle at a time with a single click or shortcut.Unlike the full Replay Mode, which required right-clicking and jumping back manually, this tool gives you a faster, smoother way to rewind just a few candles — without losing your place or breaking your flow.
how-to-use-bar-by-bar-rewind
August 21, 2025
How to Drag and Place Stop Loss & Take Profit on the Chart
With Drag-to-Place SL & TP, you can instantly manage risk and targets by dragging ghost markers directly on your chart.Every time you place a trade, FX Replay automatically displays draggable Stop Loss (orange) and Take Profit (green) lines. Just grab, drop, and confirm — no menus required.This feature makes backtesting faster, smoother, and more intuitive.
how-to-drag-and-place-stop-loss-take-profit-on-the-chart
August 20, 2025
How to Place Trades with Right-Click Order Execution
Right-Click Trading allows you to react in real time by placing limit or stop orders directly from the chart.No panels to open, no extra clicks, no delays — just seamless execution. FX Replay automatically detects whether the price you click is above or below market and shows the correct Buy/Sell options.
how-to-place-trades-with-right-click-order-execution
August 20, 2025
How to Use Keyboard Shortcuts & Tooltips
The Shortcut & Tooltip System in FX Replay speeds up your workflow by making every action just one keystroke away.From placing orders to navigating sessions, shortcuts let you move instantly. Tooltips show you what each button does — so you’re never left guessing.
how-to-use-keyboard-shortcuts-tooltips
August 19, 2025
How to Use Scalper Mode for Faster Trade Execution
Scalper Mode is designed for traders who value speed and efficiency. It allows you to predefine your:Stop Loss (SL)Take Profit (TP)Auto Break Even (BE)Once set up, every trade you place with Quick Buy/Sell will automatically use your saved configuration — helping you focus on price action instead of retyping order details.
how-to-use-scalper-mode-for-faster-trade-execution
August 19, 2025
How to Use the RR Simulator
This tool takes your real trades and shows how performance would shift if you had aimed for different take profit (TP) levels — without changing your entry or stop loss (SL).
how-to-use-the-rr-simulator
August 19, 2025
Accounts, Access & Assets
Can I trade any asset in a battle? Free users can trade non-premium pairs; Pro users have access to all assets....
accounts-access-assets
August 14, 2025
Navigation & Participation
navigation-participation
August 14, 2025
Battle Types & Objectives
battle-types-objectives
August 14, 2025
Battle Creation & Hosting
battle-creation-hosting
August 14, 2025
Battle Flow & Controls
battle-flow-controls
August 14, 2025
Rules & Mechanics
rules-mechanics
August 14, 2025
Chat & Comunication
chat-comunication
August 14, 2025
General Overview
general-overview
August 14, 2025
Issues editing Fibonacci levels
issues-editing-fibonacci-levels
August 6, 2025
I am unable to save notes in the journal
Clear your browser’s cache and cookies. Disable ad blockers or privacy extensions temporarily — this may block journal saving scripts
i-am-unable-to-save-notes-in-the-journal
August 1, 2025
I am unable to play out my session
i-am-unable-to-play-out-my-session
August 1, 2025
Why isn't my trade being placed?
why-isnt-my-trade-being-placed
August 1, 2025
I can't place a buy - I get an error
i-cant-place-a-buy-i-get-an-error
August 1, 2025
My Chart will not load
my-chart-will-not-load
August 1, 2025
Trades and Logging
trades-and-logging
May 6, 2025
Session Stats Overview
session-stats-overview
May 1, 2025
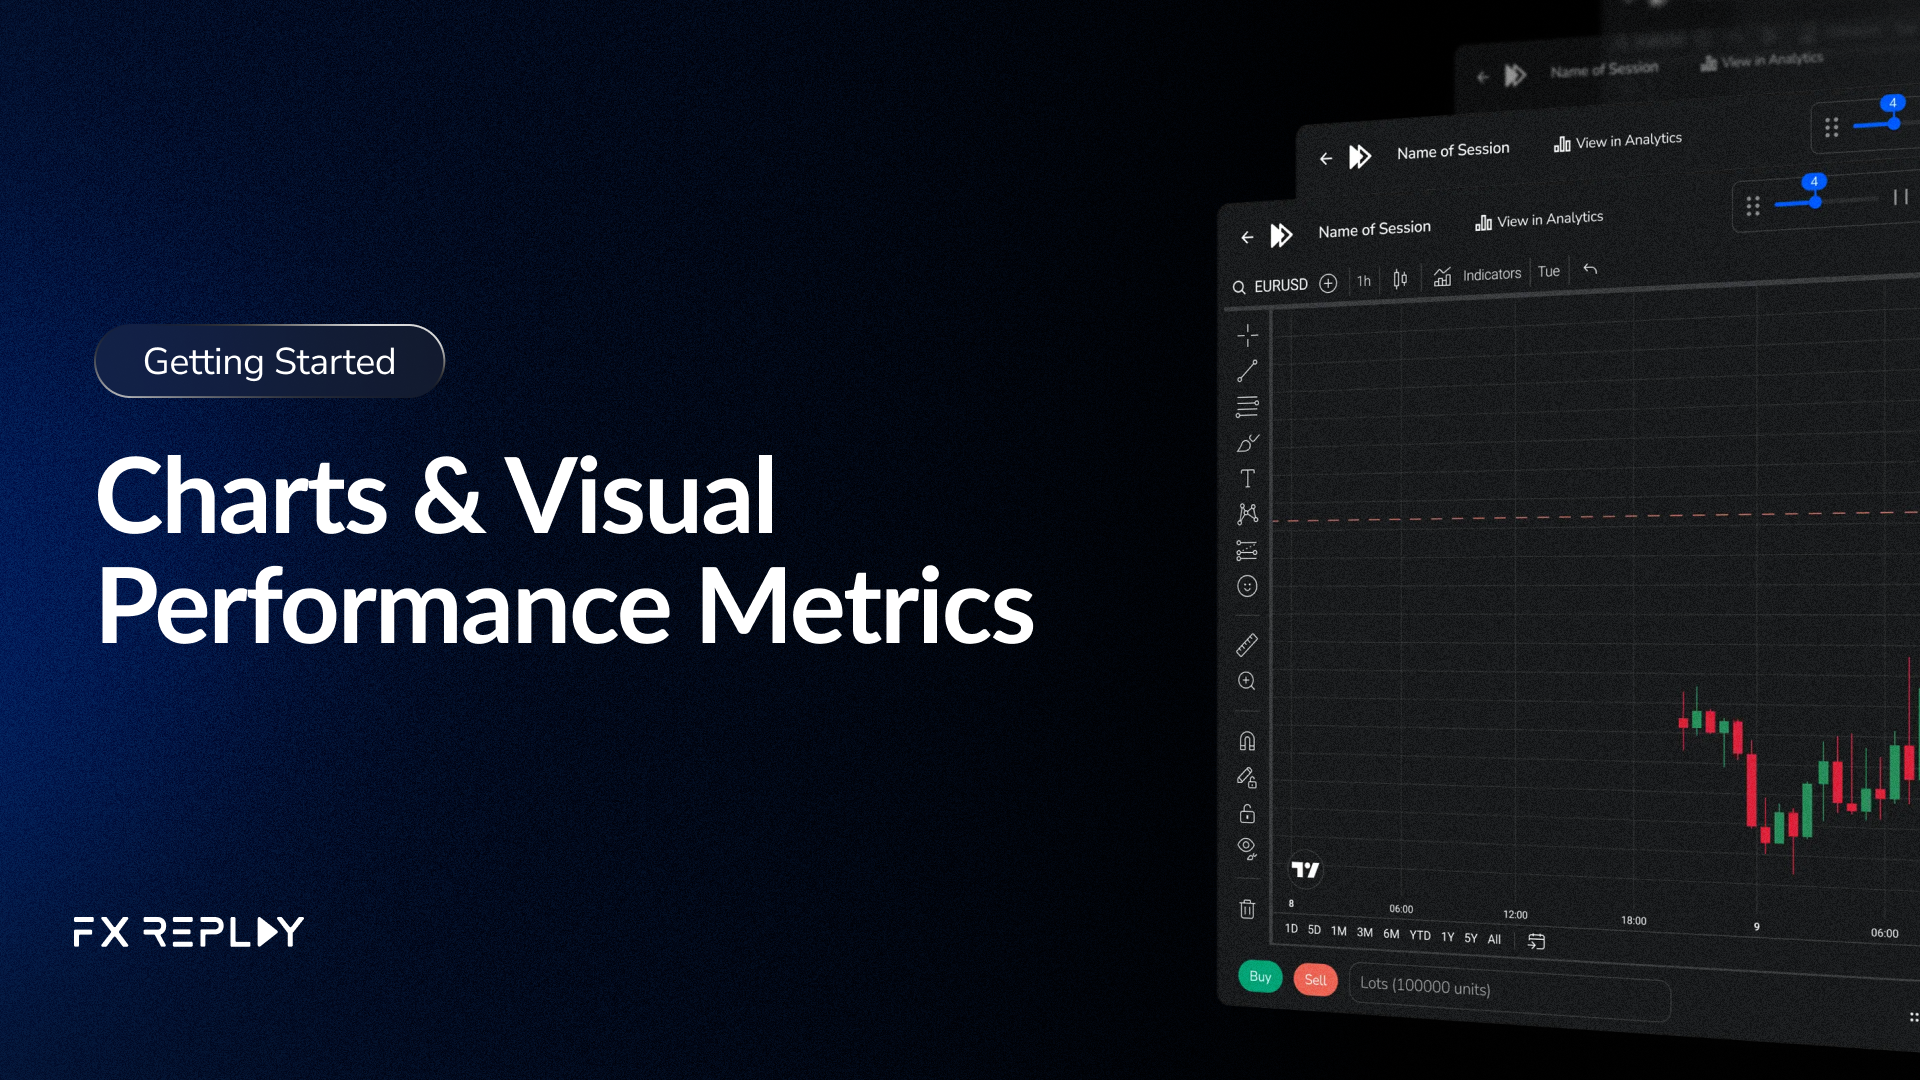
Charts & Visual Performance Metrics
charts-visual-performance-metrics
May 1, 2025
Top 5 Golden Indicators
top-5-golden-indicators
March 28, 2025
How to use the replay feature
how-to-use-the-replay-feature
February 27, 2025
Multipair - Feature
multipair---feature
February 7, 2025
Analytic Metrics Defined
analytic-metrics-defined
February 7, 2025
Mastering the Replay Feature
mastering-the-replay-feature
February 7, 2025
Using the Economic Calendar Feature
using-the-economic-calendar-feature
February 7, 2025
Comprehensive Futures Trading Guide
comprehensive-futures-trading-guide
February 7, 2025
Understanding Spreads and Commissions
understanding-spreads-and-commissions
February 7, 2025
Introducing OANDA: Our New Data Provider
introducing-oanda-our-new-data-provider
February 7, 2025
Tracking Your Trades with the Journal Feature
tracking-your-trades-with-the-journal-feature
February 7, 2025
Maximize Your Backtesting: Explore Multiple Assets with FX Replay
maximize-your-backtesting-explore-multiple-assets-with-fx-replay
February 7, 2025
Understanding Price Differences: Forex vs. Futures Markets
understanding-price-differences-forex-vs-futures-markets
February 7, 2025
Understanding Swing Highs and Lows in Trading
understanding-swing-highs-and-lows-in-trading
February 7, 2025
Fundamental Analysis in Forex
fundamental-analysis-in-forex
February 7, 2025
How to manage Risk in trading
how-to-manage-risk-in-trading
February 7, 2025
Currency Correlations
currency-correlations
February 7, 2025
What to do if your chart isn't displaying candle bars?
what-to-do-if-your-chart-isnt-displaying-candle-bars
February 7, 2025
Session freezes and the price data stops
session-freezes-and-the-price-data-stops
February 7, 2025
I can not get past CAPTCHA
i-can-not-get-past-captcha
February 7, 2025
When is support available?
when-is-support-available
February 7, 2025
FTMO Discount
ftmo-discount
February 7, 2025
Unable to access my account
unable-to-access-my-account
February 7, 2025
How to add the Session Indicator?
how-to-add-the-session-indicator
February 7, 2025
How to save my Indicator settings?
how-to-save-my-indicator-settings
February 6, 2025
How to use the Monte Carlo Simulation?
how-to-use-the-monte-carlo-simulation
February 6, 2025
Does FX Replay offer a free trial?
does-fx-replay-offer-a-free-trial
February 6, 2025
What candles does FX Replay offer?
what-candles-does-fx-replay-offer
February 6, 2025
How to use tags when backtesting?
how-to-use-tags-when-backtesting
February 6, 2025
How to create a backtesting session?
how-to-create-a-backtesting-session
February 6, 2025
Am I able to save drawing templates?
am-i-able-to-save-drawing-templates
February 6, 2025
What is the smoothing candle feature?
what-is-the-smoothing-candle-feature
February 6, 2025
How to Take Partial Profits in FX Replay?
how-to-take-partial-profits-in-fx-replay
February 6, 2025
What assets are available for backtesting?
what-assets-are-available-for-backtesting
February 6, 2025
Do charts have AutoSave? My charts are not saving.
do-charts-have-autosave-my-charts-are-not-saving
February 6, 2025
How to separate markings on your charts for different backtesting sessions?
how-to-separate-markings-on-your-charts-for-different-backtesting-sessions
February 6, 2025
What are the trading session hours that FX Replay takes into account for analytics?
what-are-the-trading-session-hours-that-fx-replay-takes-into-account-for-analytics
February 6, 2025
Is it possible to have multiple charts (each with different timeframes or different pairs)?
is-it-possible-to-have-multiple-charts-each-with-different-timeframes-or-different-pairs
February 6, 2025
How far back does the data go? Can I trade the 1m far back?
how-far-back-does-the-data-go-can-i-trade-the-1m-far-back
February 6, 2025
What broker data sources does FX Replay use for its charts?
what-broker-data-sources-does-fx-replay-use-for-its-charts
February 6, 2025
Is it possible to rewind to a specific point in the price chart?
is-it-possible-to-rewind-to-a-specific-point-in-the-price-chart
February 6, 2025
Do you have an affiliate program?
do-you-have-an-affiliate-program
February 6, 2025
How to Cancel My Subscription
how-to-cancel-my-subscription
February 6, 2025
What is your refund/cancellation policy?
what-is-your-refund-policy
February 6, 2025
Available hotkeys for FX Replay
available-hotkeys-for-fx-replay
February 6, 2025
What indicators does FX Replay offer?
what-indicators-does-fx-replay-offer
February 6, 2025
How many devices can I use with FX Replay, and are there any session limits?
how-many-devices-can-i-use-with-fx-replay-and-are-there-any-session-limits
February 6, 2025
Can I add my own custom indicators from TradingView?
can-i-add-my-own-custom-indicators-from-tradingview
February 6, 2025
What payment methods are available?
what-payment-methods-are-available
February 6, 2025
What Are the Differences Between FX Replay Plans and Their Pricing?
what-are-the-differences-between-fx-replay-plans-and-their-pricing
February 6, 2025
Saving a Chart Layout
saving-a-chart-layout
February 6, 2025
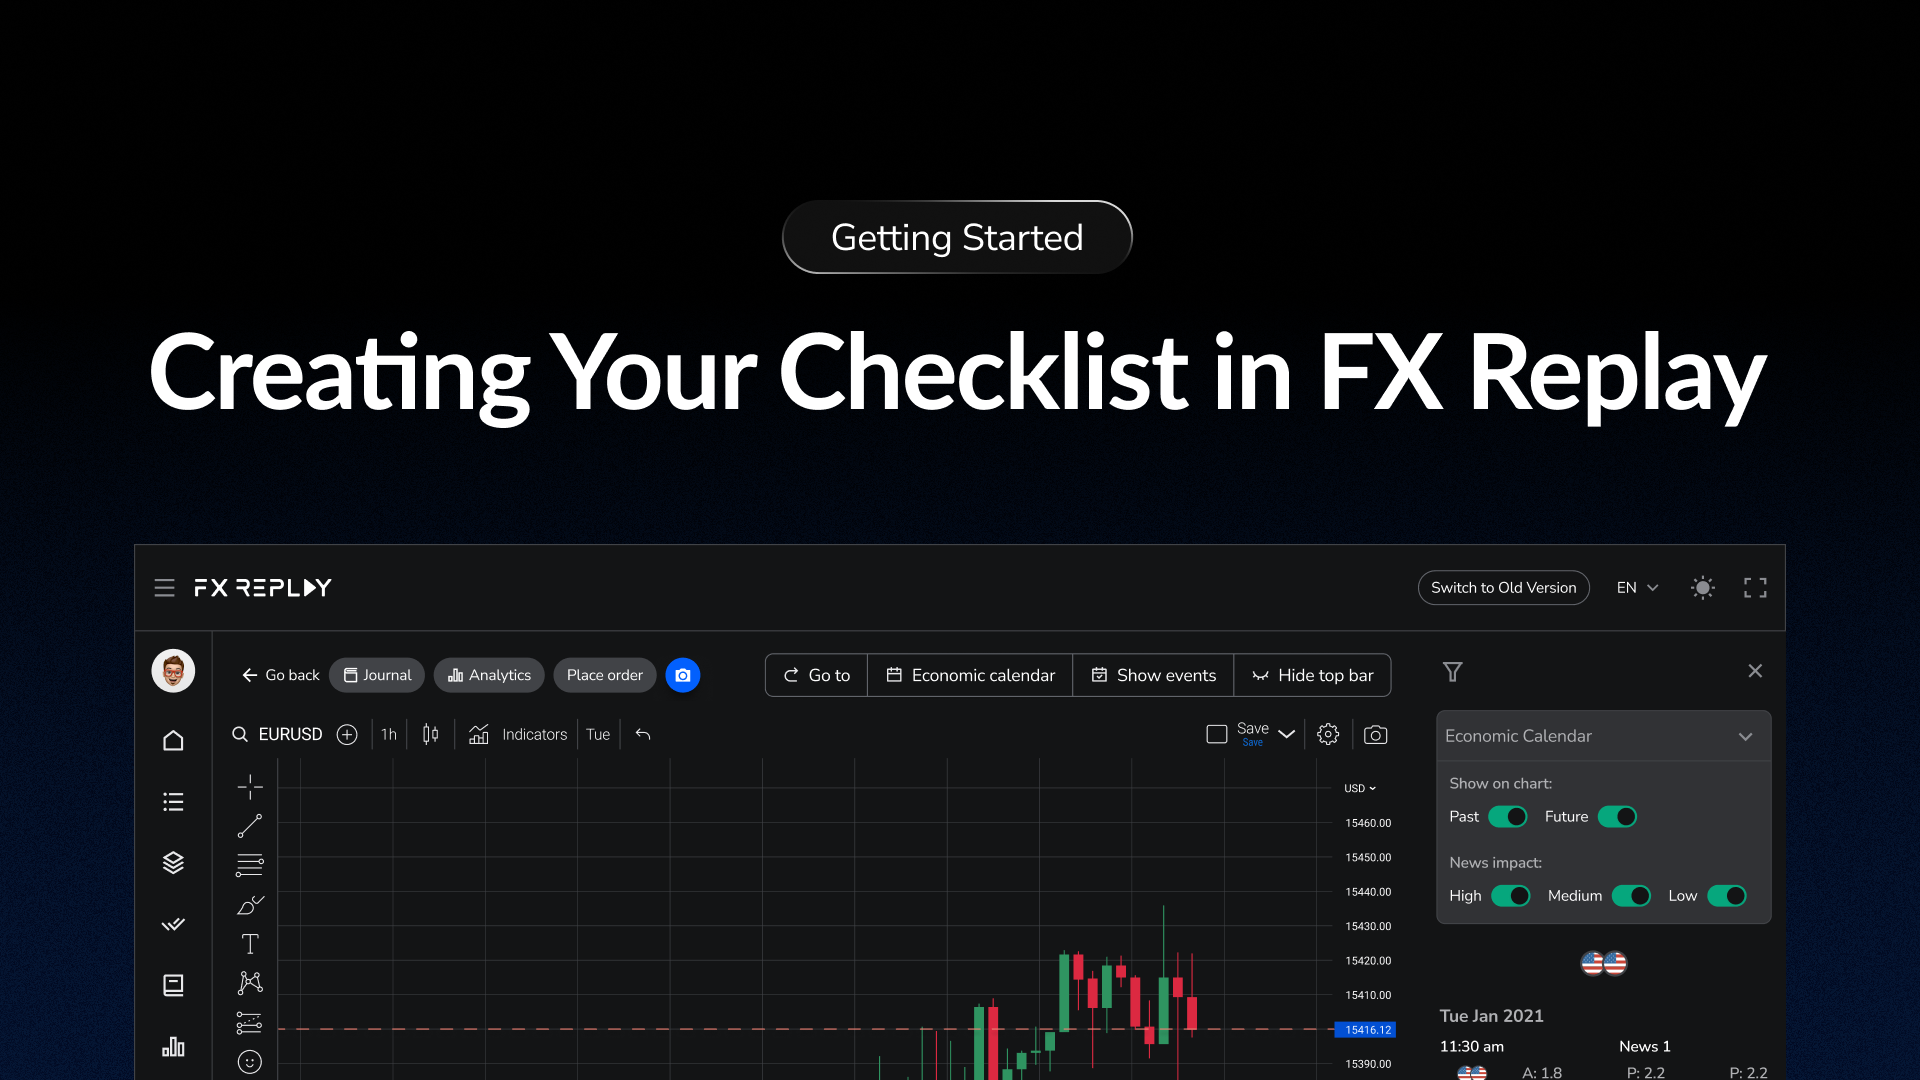
Creating Your Checklist in FX Replay
creating-your-checklist-in-fx-replay
February 6, 2025
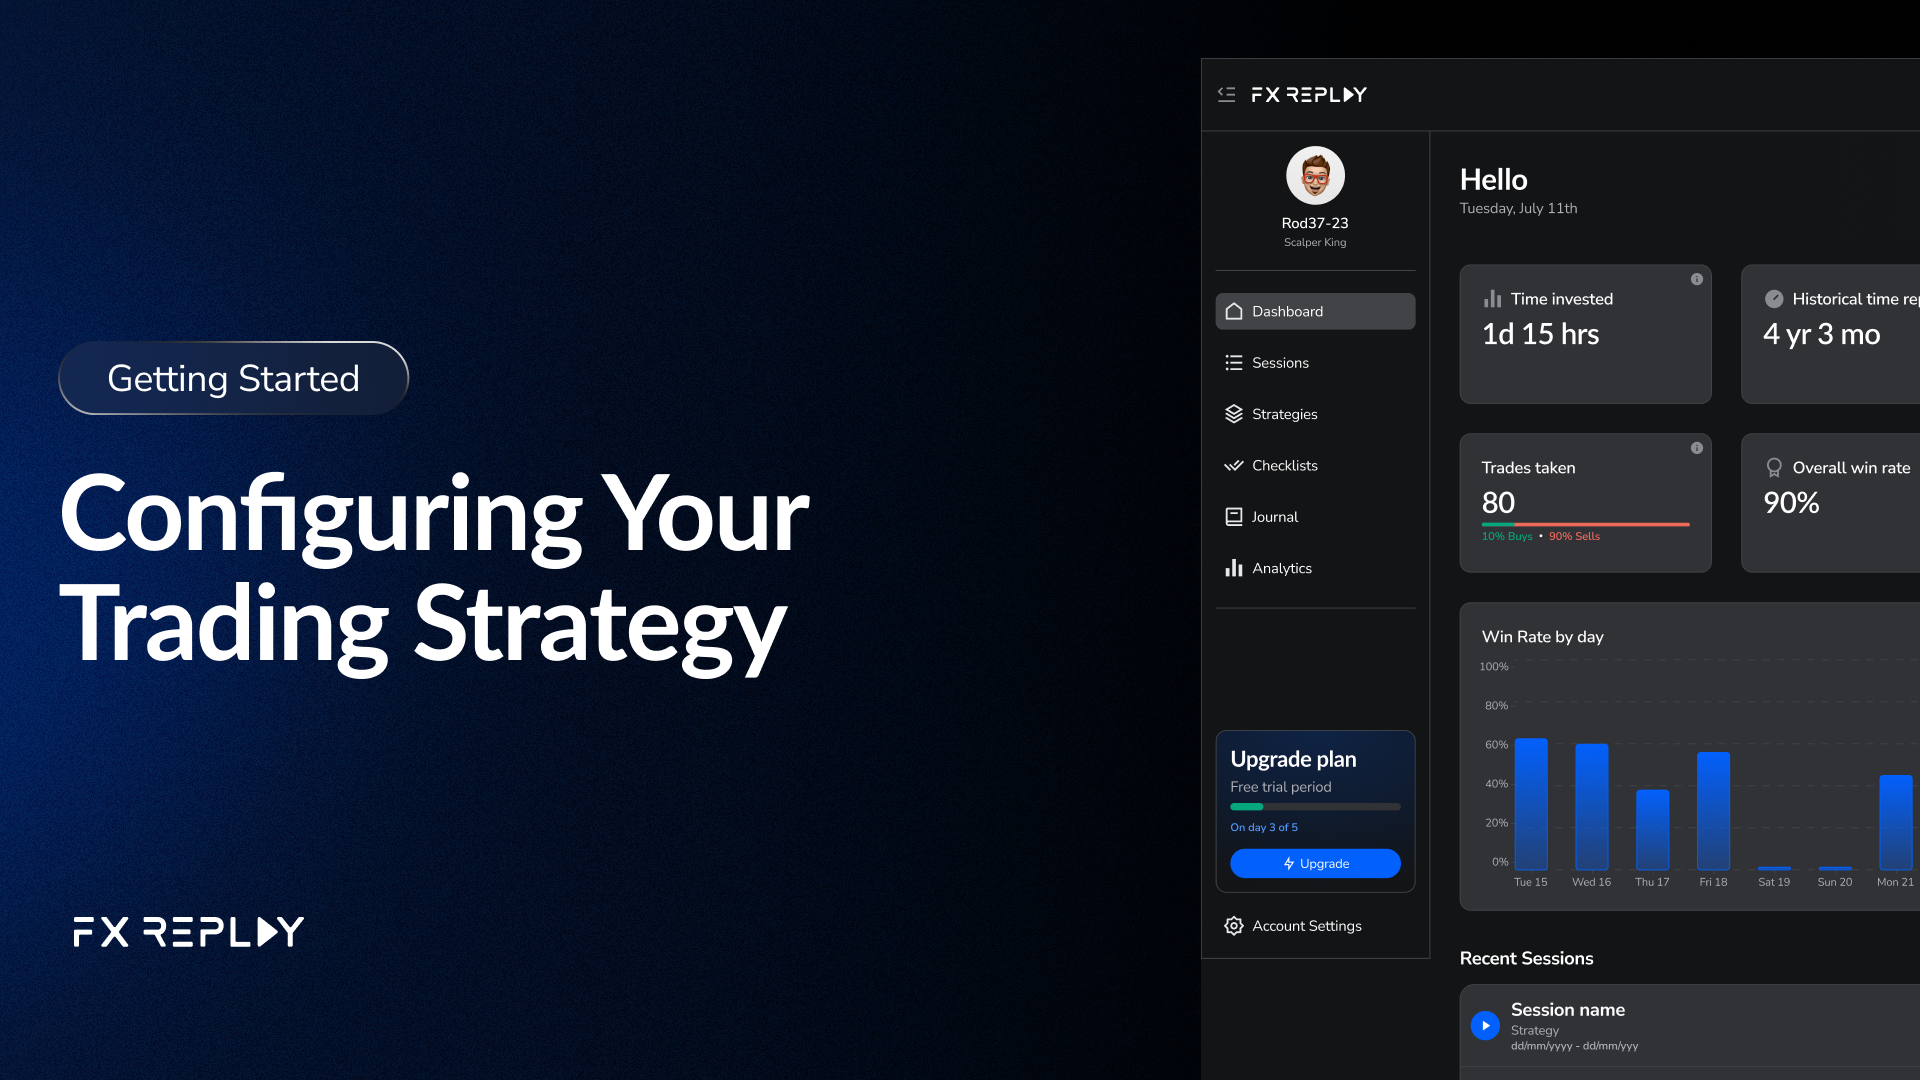
Configuring Your Trading Strategy
configuring-your-trading-strategy
February 6, 2025
Setting Up Your First Backtesting Session
setting-up-your-first-backtesting-session
February 6, 2025
Exploring the Trader Dashboard: Overview
exploring-the-trader-dashboard-overview
January 6, 2025
Introduction to Forex Backtesting: What You Need to Know
introduction-to-forex-backtesting-what-you-need-to-know-7e087
December 26, 2024
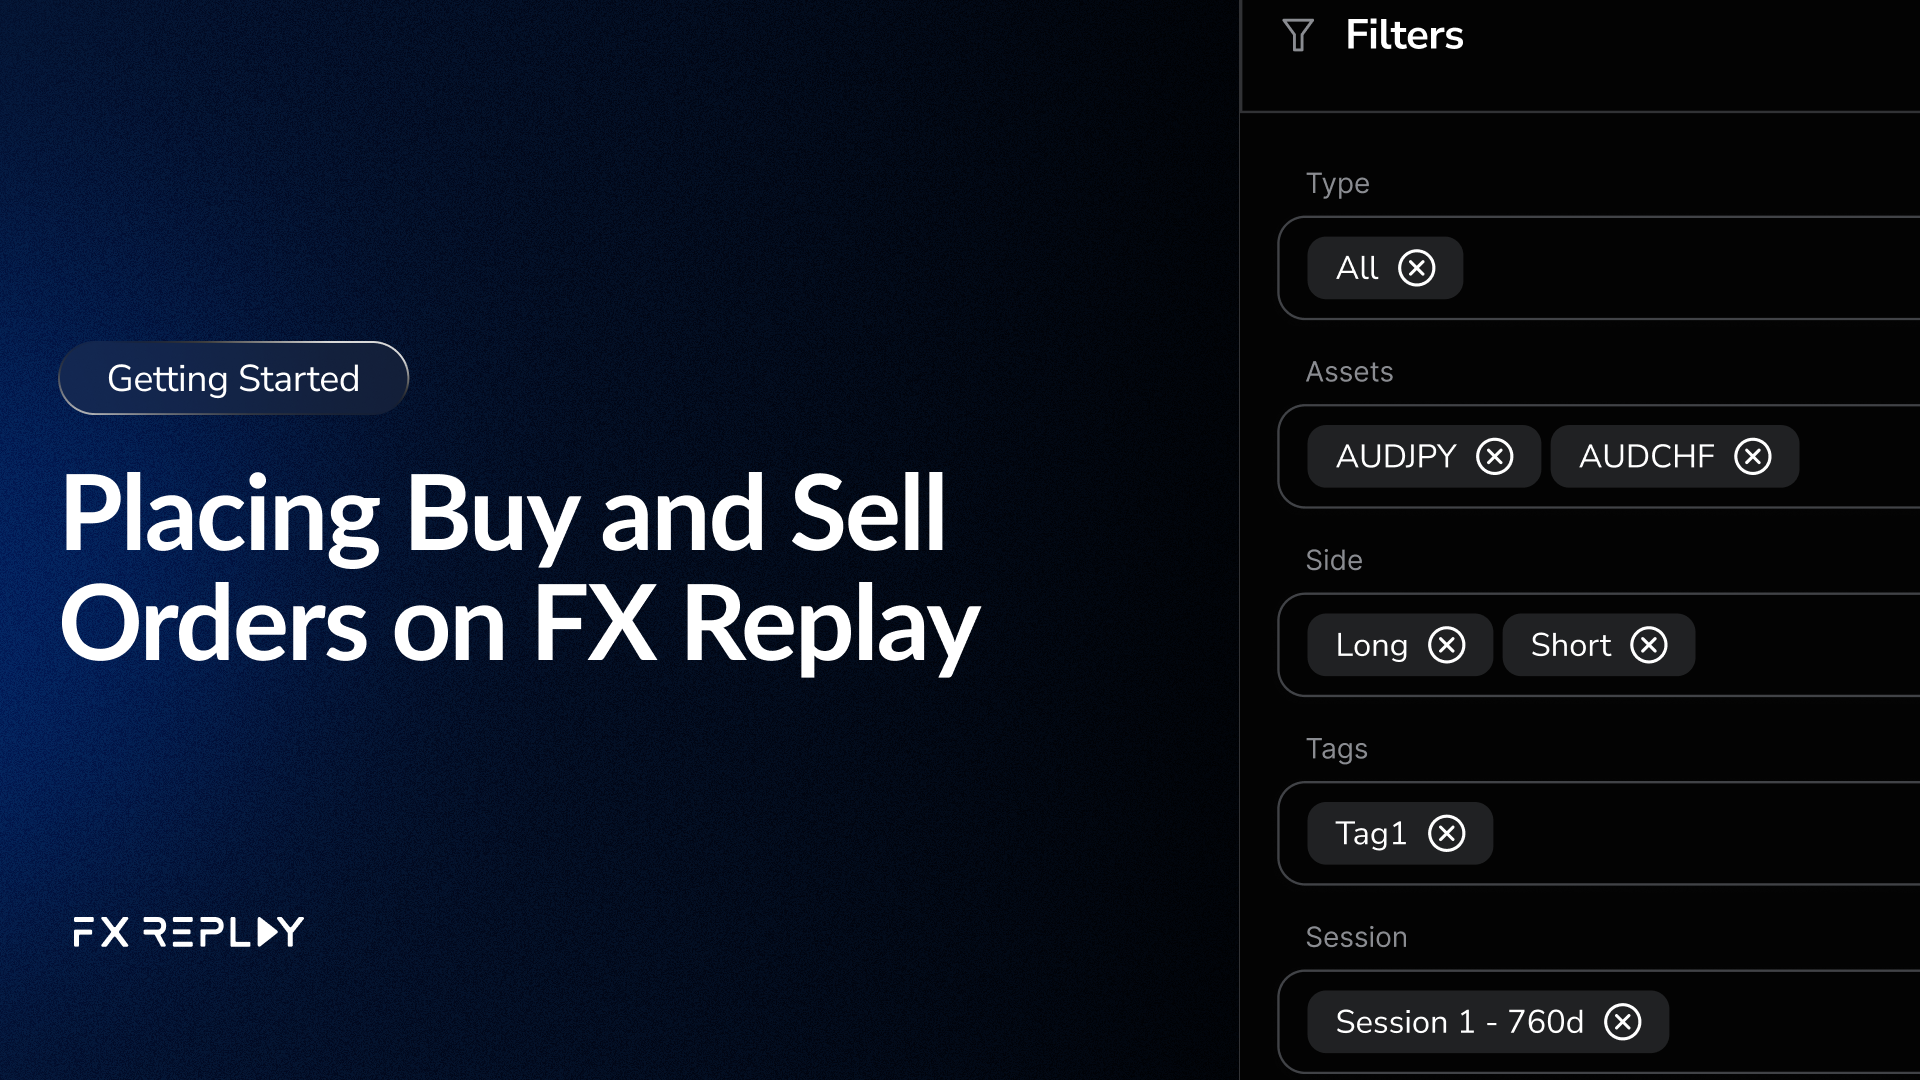
Placing Buy and Sell Orders on FX Replay
placing-buy-and-sell-orders-on-fx-replay
December 26, 2024
Trading on Seconds Timeframes in Forex and Futures Markets
trading-on-seconds-timeframes-in-forex-and-futures-markets
December 17, 2024
Analyzing Your Trades: How to Use the FX Replay Analytics Page
analyzing-your-trades-how-to-use-the-fx-replay-analytics-page
December 17, 2024
Stay Connected with FX Replay on Social Media
stay-connected-with-fx-replay-on-social-media
December 17, 2024
Join our Discord community
join-our-discord-community
December 17, 2024
Basic Troubleshooting
basic-troubleshooting
December 17, 2024
Refund Policy
refund-policy
December 17, 2024
Does journaling work the same in Live and Testing?
Yes. Journaling works the same whether you’re in a Live session or Testing session.
does-journaling-work-the-same-in-live-and-testing
does-journaling-work-the-same-in-live-and-testing
Where are my journal entries stored?
Journal entries are stored inside your FX Replay account and remain tied to the trades and sessions where they were created.
where-are-my-journal-entries-stored
where-are-my-journal-entries-stored
Can I rename a tag in the journal?
No. Tags cannot be renamed. If you want to change a tag name, create a new tag and stop using the old one.
can-i-rename-a-tag-in-the-journal
can-i-rename-a-tag-in-the-journal
Can I search journal entries by keyword?
Yes. The Journal search bar allows you to search by words, tags, or phrases inside your notes.
can-i-search-journal-entries-by-keyword
can-i-search-journal-entries-by-keyword
Can I bulk delete journal entries?
Not currently. Journal entries must be deleted one at a time.
can-i-bulk-delete-journal-entries
can-i-bulk-delete-journal-entries
Does the Journal include a checklist?
Yes. The checklist appears inside the Journal area of each trade, allowing you to mark behaviors and track consistency.
does-the-journal-include-a-checklist
does-the-journal-include-a-checklist
Can I journal after the session is already closed?
Yes. You can journal trades any time, even after the session has ended or been archived.
can-i-journal-after-the-session-is-already-closed
can-i-journal-after-the-session-is-already-closed
Does journaling auto-save?
Yes. Journal entries save automatically once you click outside the text field or close the trade panel.
does-journaling-auto-save
does-journaling-auto-save
Can I filter journal entries by symbol?
Yes. Filters such as symbol work the same for trades with or without journal entries.
can-i-filter-journal-entries-by-symbol
can-i-filter-journal-entries-by-symbol
Can I filter journal entries by strategy?
Yes. Filtering by strategy inside Analytics will include trades that have journal notes, allowing you to analyze performance patterns.
can-i-filter-journal-entries-by-strategy
can-i-filter-journal-entries-by-strategy
Can I sort journal entries by tag?
Yes. You can sort journal entries by any tag applied to the trades inside the session.
can-i-sort-journal-entries-by-tag
can-i-sort-journal-entries-by-tag
Can I create custom tags for my journal?
Yes. You can create custom tags that become available in your tag list for future trades.
can-i-create-custom-tags-for-my-journal
can-i-create-custom-tags-for-my-journal
Do tags show up in Analytics?
Yes. Tags appear as filters in Analytics, allowing you to analyze performance based on journal‑applied tags.
do-tags-show-up-in-analytics
do-tags-show-up-in-analytics
How do I use premade tags in the journal?
Premade tags appear in the tag list when journaling a trade. Click any tag to apply it.
how-do-i-use-premade-tags-in-the-journal
how-do-i-use-premade-tags-in-the-journal
Can I attach images to my journal entries?
Yes. You can attach screenshots to journal entries by adding them directly inside the trade’s journal panel.
can-i-attach-images-to-my-journal-entries
can-i-attach-images-to-my-journal-entries
Can I format text inside the journal notes?
Not yet. Journal notes currently support plain text only.
can-i-format-text-inside-the-journal-notes
can-i-format-text-inside-the-journal-notes
Where do I find my journal entries for a session?
Journal entries appear inside each trade panel under the Journal section of the session.
where-do-i-find-my-journal-entries-for-a-session
where-do-i-find-my-journal-entries-for-a-session
Can I journal trades during an active session?
Yes. You can journal a trade as soon as it is placed or at any time after.
can-i-journal-trades-during-an-active-session
can-i-journal-trades-during-an-active-session
Can I add multiple notes to a single trade?
Yes. You can add as many notes as you want to a single trade.
can-i-add-multiple-notes-to-a-single-trade
can-i-add-multiple-notes-to-a-single-trade
Do journal notes affect my analytics?
No. Journaling is for reflection only. Analytics is based on trade data, not journal content.
do-journal-notes-affect-my-analytics
do-journal-notes-affect-my-analytics
How do I open the Journal?
Open any session and click the Journal tab inside the session sidebar. Journaling now lives inside each individual session rather than as a separate page.
how-do-i-open-the-journal
how-do-i-open-the-journal
What is the Journal used for?
The Journal helps you record thoughts, trade reasoning, emotions, setups, and lessons learned so you can reflect and improve your trading.
what-is-the-journal-used-for
what-is-the-journal-used-for
Do I need to journal every trade?
No, but consistent journaling gives you clearer insight into habits, discipline, and recurring mistakes.
do-i-need-to-journal-every-trade
do-i-need-to-journal-every-trade
Can I delete a journal entry?
Yes. Open the trade’s journal panel and delete the specific note you want to remove.
can-i-delete-a-journal-entry
can-i-delete-a-journal-entry
Can I edit journal notes after saving them?
Yes. Open the trade, go to the Journal section, edit your note, and save the update.
can-i-edit-journal-notes-after-saving-them
can-i-edit-journal-notes-after-saving-them
Do my Battle results affect my overall stats?
Yes, results contribute to your Battles metrics, visible when filtering performance mode on the Dashboard.
do-my-battle-results-affect-my-overall-stats
do-my-battle-results-affect-my-overall-stats
Do all players in a Battle follow the same rules?
Yes, every participant plays under the exact same rules configured for that specific battle.
do-all-players-in-a-battle-follow-the-same-rules
do-all-players-in-a-battle-follow-the-same-rules
What happens when a Battle ends?
Trading locks, results are finalized, and the battle moves into a completed state with a visible podium or leaderboard.
what-happens-when-a-battle-ends
what-happens-when-a-battle-ends
Can I see my past Battles and results?
Yes, completed battles and their outcomes are visible in the Battles area and in Dashboard performance filters.
can-i-see-my-past-battles-and-results
can-i-see-my-past-battles-and-results
Can I invite friends to a Battle?
Yes, battles allow inviting other traders by email or by sharing the battle ID.
can-i-invite-friends-to-a-battle
can-i-invite-friends-to-a-battle
Can Battles use profit targets instead of time limits?
Yes, some battles are built around profit targets, while others combine a profit target with a time limit.
can-battles-use-profit-targets-instead-of-time-limits
can-battles-use-profit-targets-instead-of-time-limits
Do Battles have a time limit?
Yes, each battle sets its own duration and trading ends automatically when the timer reaches zero.
do-battles-have-a-time-limit
do-battles-have-a-time-limit
Are FXR Battles included in all subscription plans?
Yes, Battles are available on Free, Intermediate, and Pro plans.
are-fxr-battles-included-in-all-subscription-plans
are-fxr-battles-included-in-all-subscription-plans
How do I see my progress during a Battle?
Open the Leaderboard panel at the bottom of the screen or press Tab to view PnL, win rate, drawdown, and other stats.
how-do-i-see-my-progress-during-a-battle
how-do-i-see-my-progress-during-a-battle
Is there a leaderboard for FXR Battles?
Yes, each battle has its own leaderboard and there is also a global leaderboard ranking players.
is-there-a-leaderboard-for-fxr-battles
is-there-a-leaderboard-for-fxr-battles
What does In Progress mean on a battle?
In Progress means the battle has begun and the leaderboard is updating with live results.
what-does-in-progress-mean-on-a-battle
what-does-in-progress-mean-on-a-battle
What does Standby mean on a battle?
Standby means the battle has not started yet and participants are in the lobby.
what-does-standby-mean-on-a-battle
what-does-standby-mean-on-a-battle
Can I join a battle that is already in progress?
Yes, if a battle is marked In Progress and still allows new entries, you can join it.
can-i-join-a-battle-that-is-already-in-progress
can-i-join-a-battle-that-is-already-in-progress
Are there different win conditions in Battles?
Yes, battles can be time based or profit target based, or a combination of both.
are-there-different-win-conditions-in-battles
are-there-different-win-conditions-in-battles
How do FXR Battles work?
You join a challenge with predefined rules, complete the session, and your performance is ranked on a leaderboard against other traders.
how-do-fxr-battles-work
how-do-fxr-battles-work
How is the winner determined in FXR Battles?
The winner is decided by the battle’s win condition, such as highest profit by time end or the first trader to reach the profit target.
how-is-the-winner-determined-in-fxr-battles
how-is-the-winner-determined-in-fxr-battles
Where can I see the rules for a Battle?
You can view all battle rules in the battle lobby and in the rules panel, including limits and win conditions.
where-can-i-see-the-rules-for-a-battle
where-can-i-see-the-rules-for-a-battle
Is each Battle based on historical market data?
Yes, all battles run on the same historical chart data used in regular FX Replay sessions.
is-each-battle-based-on-historical-market-data
is-each-battle-based-on-historical-market-data
Can Battles be public or private?
Yes, you can create public battles that anyone can join or private battles that require an invite or battle ID.
can-battles-be-public-or-private
can-battles-be-public-or-private
What kinds of rules can a Battle include?
A Battle can define starting balance, profit target, max drawdown, max daily drawdown, time limit, max participants, allowed assets, and the win condition.
what-kinds-of-rules-can-a-battle-include
what-kinds-of-rules-can-a-battle-include
What makes a Battle different from regular backtesting?
Battles use the same replay engine but add fixed rules, win conditions, and a shared leaderboard so you can compare your performance to others.
what-makes-a-battle-different-from-regular-backtesting
what-makes-a-battle-different-from-regular-backtesting
Can I create my own Battle?
Yes, click New Battle from the Battles page and follow the creation steps to choose rules, balance, assets, and limits.
can-i-create-my-own-battle
can-i-create-my-own-battle
Where do I find FXR Battles?
Go to the Battles page from the main navigation to see public battles, joined battles, and the global leaderboard.
where-do-i-find-fxr-battles
where-do-i-find-fxr-battles
How do I join an FXR Battle?
Open the Battles page, browse the list of public battles, and click Join on the one you want to participate in.
how-do-i-join-an-fxr-battle
how-do-i-join-an-fxr-battle
What are FXR Battles?
FXR Battles are competitive challenges where traders use historical market data to test their skills and compare results against other participants.
what-are-fxr-battles
what-are-fxr-battles
Can I switch languages without restarting FX Replay?
Yes, when you choose a new language from the top-right language menu, the interface switches instantly without needing to restart your session.
can-i-switch-languages-without-restarting-fx-replay
can-i-switch-languages-without-restarting-fx-replay
How do I change the platform language in FX Replay?
From the Dashboard, hover to the top right, click the two-letter language code with the down arrow, and select your preferred language from the list.
how-do-i-change-the-platform-language-in-fx-replay
how-do-i-change-the-platform-language-in-fx-replay
Which languages does FX Replay support?
FX Replay supports English, Español, Deutsch, Français, Türkçe, Українська, Português, and Русский.
which-languages-does-fx-replay-support
which-languages-does-fx-replay-support
How often does the Battles leaderboard update after matches?
The leaderboard updates automatically after all trades in a battle are finalized, reflecting your new ELO and rank shortly after each result.
how-often-does-the-battles-leaderboard-update-after-matches
how-often-does-the-battles-leaderboard-update-after-matches
How do I view only my friends on the leaderboard?
Use the filters at the top of the leaderboard to switch from Global to Friends so you only see rankings for people you have added.
how-do-i-view-only-my-friends-on-the-leaderboard
how-do-i-view-only-my-friends-on-the-leaderboard
How do I accept or decline a battle invite?
Open the Requests or battle invites panel and click Accept or Decline next to the invite you want to respond to.
how-do-i-accept-or-decline-a-battle-invite
how-do-i-accept-or-decline-a-battle-invite
What is the Battle Invites panel used for?
The battle invites panel shows all incoming and outgoing match requests so you can review, accept, or decline challenges from other traders.
what-is-the-battle-invites-panel-used-for
what-is-the-battle-invites-panel-used-for
Will FX Replay notify me when I receive a new battle invite?
Yes, when a new battle invite arrives, a notification icon appears on your profile so you know to open the Requests tab and respond.
will-fx-replay-notify-me-when-i-receive-a-new-battle-invite
will-fx-replay-notify-me-when-i-receive-a-new-battle-invite
What is the Battles leaderboard and where can I see it?
The Battles leaderboard shows global and friend rankings based on ELO, win rate, and performance, and you can open it from the Battles page.
what-is-the-battles-leaderboard-and-where-can-i-see-it
what-is-the-battles-leaderboard-and-where-can-i-see-it
How do I invite a friend to join a specific battle?
Open an active battle card and click Invite friend, then choose a user from your friends list to send them a battle invite.
how-do-i-invite-a-friend-to-join-a-specific-battle
how-do-i-invite-a-friend-to-join-a-specific-battle
How do I remove someone from my friends list?
Open your friends list on the right-side panel, click the three-dot menu next to their name, and select Remove to delete them from your friends.
how-do-i-remove-someone-from-my-friends-list
how-do-i-remove-someone-from-my-friends-list
How do I accept or decline a friend request in Battles?
Go to the right-side panel and open the Requests tab, then click Accept or Decline next to each pending friend request.
how-do-i-accept-or-decline-a-friend-request-in-battles
how-do-i-accept-or-decline-a-friend-request-in-battles
How do I search for new traders to add as friends?
Open the add friends window from your home profile, use the search bar to look up traders by their username or ELO, then click Send invite to connect.
how-do-i-search-for-new-traders-to-add-as-friends
how-do-i-search-for-new-traders-to-add-as-friends
Where do I see my friends list in Battles?
On the Battles home screen, look at the right-side panel to see your friends list, including their username, avatar, and ELO rating.
where-do-i-see-my-friends-list-in-battles
where-do-i-see-my-friends-list-in-battles
How do I add friends in FX Replay Battles?
On the Battles home profile, click the add friend icon, search for a trader by username or ELO, and send them a friend invite.
how-do-i-add-friends-in-fx-replay-battles
how-do-i-add-friends-in-fx-replay-battles
Can I use the AI Mentor to understand Battles and rankings?
Yes, you can ask the AI Mentor what ELO means, how the leaderboard works, and how to improve your battle performance, and it will explain in plain language.
can-i-use-the-ai-mentor-to-understand-battles-and-rankings
can-i-use-the-ai-mentor-to-understand-battles-and-rankings
What is the resource center on the Dashboard and what can I do with it?
The resource center opens when you click the Help button and lets you access the Help Center, report bugs, request features, join webinars, view free strategy content, and connect to FX Replay’s social media.
what-is-the-resource-center-on-the-dashboard-and-what-can-i-do-with-it
what-is-the-resource-center-on-the-dashboard-and-what-can-i-do-with-it
How can the AI Mentor help me while I am using FX Replay?
You can ask the AI Mentor questions like what a feature means, how to join battles, why your rank changed, or where to find settings, and it will guide you step by step.
how-can-the-ai-mentor-help-me-while-i-am-using-fx-replay
how-can-the-ai-mentor-help-me-while-i-am-using-fx-replay
How do I connect with FX Replay on social media from the platform?
Open the resource center from the Help button on the Dashboard to find links to FX Replay’s YouTube, Instagram, and X channels.
how-do-i-connect-with-fx-replay-on-social-media-from-the-platform
how-do-i-connect-with-fx-replay-on-social-media-from-the-platform
What is the Help Center in FX Replay?
The Help Center is where you can report bugs, request new features, and send feedback about FX Replay so the team can improve the platform.
what-is-the-help-center-in-fx-replay
what-is-the-help-center-in-fx-replay
How do I request a new feature for FX Replay?
Open the Help button or resource center and choose Request a Feature to submit your idea directly to the FX Replay team.
how-do-i-request-a-new-feature-for-fx-replay
how-do-i-request-a-new-feature-for-fx-replay
Where can I find tutorials, webinars, and strategy resources in FX Replay?
From the Dashboard, click the Help button to open the resource center, where you can join product webinars and access free strategy resources.
where-can-i-find-tutorials-webinars-and-strategy-resources-in-fx-replay
where-can-i-find-tutorials-webinars-and-strategy-resources-in-fx-replay
Where can I send general feedback about the platform?
Use the Help button and select Feedback inside the Help Center or resource center to share comments, suggestions, or issues.
where-can-i-send-general-feedback-about-the-platform
where-can-i-send-general-feedback-about-the-platform
How can I report a bug while using FX Replay?
Click the Help button on the Dashboard or relevant page, select Report a bug, and follow the prompts to describe what went wrong.
how-can-i-report-a-bug-while-using-fx-replay
how-can-i-report-a-bug-while-using-fx-replay
How do I open the Help Center from the Dashboard?
On the Dashboard, click the Help button to open the resource center, then choose the Help Center to access support options.
how-do-i-open-the-help-center-from-the-dashboard
how-do-i-open-the-help-center-from-the-dashboard
Why don't indicators stay on my chart?
Layouts reset when switching symbols. Reapply indicators manually.
why-dont-indicators-stay-on-my-chart
why-dont-indicators-stay-on-my-chart
How do I contact support?
Click Help → Resource Center → Report a Bug or Request Support.
Or open a ticket with our Support Team: https://support.fxreplay.com/request-form
how-do-i-contact-support
how-do-i-contact-support
Why was I logged out?
Automatic logout occurs after inactivity for security.
why-was-i-logged-out
why-was-i-logged-out
Why are candles not printing?
Check that playback is running and the session is within market hours.
why-are-candles-not-printing
why-are-candles-not-printing
Why is my screen blank?
Enable hardware acceleration in your browser settings.
why-is-my-screen-blank
why-is-my-screen-blank
Why aren't trades saving?
Your connection may have dropped. Refresh the platform and continue.
why-arent-trades-saving
why-arent-trades-saving
Why can’t I restore a session?
It can’t be restored if permanently deleted using Delete Forever.
why-cant-i-restore-a-session
why-cant-i-restore-a-session
Why isn't fast‑forward working?
The session must contain valid replay data for that date/time.
why-isnt-fast-forward-working
why-isnt-fast-forward-working
Why is the UI zoomed in?
Reset browser zoom to 100% via Ctrl/Cmd + 0.
why-is-the-ui-zoomed-in
why-is-the-ui-zoomed-in
Where did my sessions go?
They may be in Deleted Sessions under Account Settings.
where-did-my-sessions-go
where-did-my-sessions-go
Why can’t I join Battles?
Ensure Battles are supported in your plan and refresh the page.
why-cant-i-join-battles
why-cant-i-join-battles
Why can’t I download my invoice?
Pop‑up blockers may block downloads. Allow pop‑ups in your browser.
why-cant-i-download-my-invoice
why-cant-i-download-my-invoice
Why is my billing history empty?
It only displays paid invoices once you have a subscription.
why-is-my-billing-history-empty
why-is-my-billing-history-empty
How do I fix my timezone?
Go to Account Settings → Account → Timezone and save changes.
how-do-i-fix-my-timezone
how-do-i-fix-my-timezone
Why did my payment fail?
Verify card details and billing address under Payment Methods.
why-did-my-payment-fail
why-did-my-payment-fail
Why won’t my profile picture upload?
Use a PNG or JPG under 2MB and try again.
why-wont-my-profile-picture-upload
why-wont-my-profile-picture-upload
Why can’t I upgrade my plan?
Update your payment method inside Subscription → Manage Plan.
why-cant-i-upgrade-my-plan
why-cant-i-upgrade-my-plan
Why are my analytics blank?
Analytics require recorded trades. Also reset filters if needed.
why-are-my-analytics-blank
why-are-my-analytics-blank
Why can’t I access a feature?
Your current plan may not include that feature. Check Account Settings → Subscription.
why-cant-i-access-a-feature
why-cant-i-access-a-feature
Why is my data missing?
Filters or date ranges may hide trades. Reset filters or adjust your session date range.
why-is-my-data-missing
why-is-my-data-missing
Why is the platform running slowly?
Too many tabs or indicators can overload the browser. Close extra tabs or restart your browser.
why-is-the-platform-running-slowly
why-is-the-platform-running-slowly
Why can’t I place trades?
You must start or resume a session to enable trading.
why-cant-i-place-trades
why-cant-i-place-trades
Why is playback freezing?
Playback may freeze from connection drops or full browser memory. Refresh and reduce playback speed.
why-is-playback-freezing
why-is-playback-freezing
Why is my chart not loading?
Charts may fail to load due to slow internet, unsupported extensions, or cached data. Refresh the page, disable blockers, or switch to Chrome.
why-is-my-chart-not-loading
why-is-my-chart-not-loading
Why won’t my indicators load?
You may have reached your indicator limit based on your subscription plan.
why-wont-my-indicators-load
why-wont-my-indicators-load
Session Playback and Skip Button Not Working
session-playback-and-skip-button-not-working-troubleshooting
June 11, 2026
What Happens If I Miss a Promotional Offer, and Are There Alternative Discounts Available?
what-happens-if-i-miss-a-promotional-offer-and-are-there-alternative-discounts-available
May 4, 2026
Go To Date Feature for viewing data on a specific day
go-to-date-feature
April 15, 2026
Is there an option to add TradingView indicators to FX Replay?
fx-replay-indicators
April 15, 2026
Exporting Reports for the Journal
support-fxreplay-com-articles-exporting-reports-for-the-journal
November 7, 2025
Troubleshooting
troubleshooting
November 7, 2025
Coexistence with Backtesting Journal
coexistence-with-backtesting-journal
November 7, 2025
Trading Accounts
trading-accounts
November 7, 2025
Analytics
analytics
November 7, 2025
Tag Analysis
tag-analysis
November 7, 2025
Live Trades
live-trades
November 7, 2025
Overview
Learn about the new FX Replay Journal — an intelligent trading journal that connects seamlessly with major platforms to analyze performance and optimize strategies.
overview
November 7, 2025
Prop Firm Simulator
FX Replay’s Prop Firm Simulator lets you set your firm’s rules—drawdown limits, profit targets, and more—and start testing under real challenge conditions. No replaying back in time if you missed a trade — just real data, real pressure, and real preparation to help you sharpen your edge and build confidence before taking the actual challenge.
prop-firm-simulator
November 5, 2025
How to Use Drawdown Analytics
Drawdown Analytics measure how much price moves against your position — in risk multiples (R) — before eventually closing in profit.This feature gives you deeper insight into your winning trades so you can evaluate risk, tighten entries, and refine trade management.In your Analytics Dashboard, you’ll see three key metrics that reveal how much “heat” your trades typically take before reaching their targets.
how-to-use-drawdown-analytics
August 21, 2025
How to Use Bar Replay / Right-Click Replay
Bar Replay allows you to jump back to any candle in your session — instantly.With the latest update, Replay Mode is now fully integrated into the chart UI in two ways:A dedicated Replay button in the Price Skipper barA Right-click on any candle → Replay to this pointThis gives you a seamless way to rewind, review, and reset your view to any part of your session — all without reloading or breaking your flow.
how-to-use-bar-replay---right-click-replay
August 21, 2025
How to Use Bar-by-Bar Rewind
Made a mistake or want to review price action? Bar-by-Bar Rewind lets you step backward one candle at a time with a single click or shortcut.Unlike the full Replay Mode, which required right-clicking and jumping back manually, this tool gives you a faster, smoother way to rewind just a few candles — without losing your place or breaking your flow.
how-to-use-bar-by-bar-rewind
August 21, 2025
How to Drag and Place Stop Loss & Take Profit on the Chart
With Drag-to-Place SL & TP, you can instantly manage risk and targets by dragging ghost markers directly on your chart.Every time you place a trade, FX Replay automatically displays draggable Stop Loss (orange) and Take Profit (green) lines. Just grab, drop, and confirm — no menus required.This feature makes backtesting faster, smoother, and more intuitive.
how-to-drag-and-place-stop-loss-take-profit-on-the-chart
August 20, 2025
How to Place Trades with Right-Click Order Execution
Right-Click Trading allows you to react in real time by placing limit or stop orders directly from the chart.No panels to open, no extra clicks, no delays — just seamless execution. FX Replay automatically detects whether the price you click is above or below market and shows the correct Buy/Sell options.
how-to-place-trades-with-right-click-order-execution
August 20, 2025
How to Use Keyboard Shortcuts & Tooltips
The Shortcut & Tooltip System in FX Replay speeds up your workflow by making every action just one keystroke away.From placing orders to navigating sessions, shortcuts let you move instantly. Tooltips show you what each button does — so you’re never left guessing.
how-to-use-keyboard-shortcuts-tooltips
August 19, 2025
How to Use Scalper Mode for Faster Trade Execution
Scalper Mode is designed for traders who value speed and efficiency. It allows you to predefine your:Stop Loss (SL)Take Profit (TP)Auto Break Even (BE)Once set up, every trade you place with Quick Buy/Sell will automatically use your saved configuration — helping you focus on price action instead of retyping order details.
how-to-use-scalper-mode-for-faster-trade-execution
August 19, 2025
How to Use the RR Simulator
This tool takes your real trades and shows how performance would shift if you had aimed for different take profit (TP) levels — without changing your entry or stop loss (SL).
how-to-use-the-rr-simulator
August 19, 2025
Accounts, Access & Assets
Can I trade any asset in a battle? Free users can trade non-premium pairs; Pro users have access to all assets....
accounts-access-assets
August 14, 2025
Navigation & Participation
navigation-participation
August 14, 2025
Battle Types & Objectives
battle-types-objectives
August 14, 2025
Battle Creation & Hosting
battle-creation-hosting
August 14, 2025
Battle Flow & Controls
battle-flow-controls
August 14, 2025
Rules & Mechanics
rules-mechanics
August 14, 2025
Chat & Comunication
chat-comunication
August 14, 2025
General Overview
general-overview
August 14, 2025
Issues editing Fibonacci levels
issues-editing-fibonacci-levels
August 6, 2025
I am unable to save notes in the journal
Clear your browser’s cache and cookies. Disable ad blockers or privacy extensions temporarily — this may block journal saving scripts
i-am-unable-to-save-notes-in-the-journal
August 1, 2025
I am unable to play out my session
i-am-unable-to-play-out-my-session
August 1, 2025
Why isn't my trade being placed?
why-isnt-my-trade-being-placed
August 1, 2025
I can't place a buy - I get an error
i-cant-place-a-buy-i-get-an-error
August 1, 2025
My Chart will not load
my-chart-will-not-load
August 1, 2025
Trades and Logging
trades-and-logging
May 6, 2025
Session Stats Overview
session-stats-overview
May 1, 2025
Charts & Visual Performance Metrics
charts-visual-performance-metrics
May 1, 2025
Top 5 Golden Indicators
top-5-golden-indicators
March 28, 2025
How to use the replay feature
how-to-use-the-replay-feature
February 27, 2025
Multipair - Feature
multipair---feature
February 7, 2025
Analytic Metrics Defined
analytic-metrics-defined
February 7, 2025
Mastering the Replay Feature
mastering-the-replay-feature
February 7, 2025
Using the Economic Calendar Feature
using-the-economic-calendar-feature
February 7, 2025
Comprehensive Futures Trading Guide
comprehensive-futures-trading-guide
February 7, 2025
Understanding Spreads and Commissions
understanding-spreads-and-commissions
February 7, 2025
Introducing OANDA: Our New Data Provider
introducing-oanda-our-new-data-provider
February 7, 2025
Tracking Your Trades with the Journal Feature
tracking-your-trades-with-the-journal-feature
February 7, 2025
Maximize Your Backtesting: Explore Multiple Assets with FX Replay
maximize-your-backtesting-explore-multiple-assets-with-fx-replay
February 7, 2025
Understanding Price Differences: Forex vs. Futures Markets
understanding-price-differences-forex-vs-futures-markets
February 7, 2025
Understanding Swing Highs and Lows in Trading
understanding-swing-highs-and-lows-in-trading
February 7, 2025
Fundamental Analysis in Forex
fundamental-analysis-in-forex
February 7, 2025
How to manage Risk in trading
how-to-manage-risk-in-trading
February 7, 2025
Currency Correlations
currency-correlations
February 7, 2025
What to do if your chart isn't displaying candle bars?
what-to-do-if-your-chart-isnt-displaying-candle-bars
February 7, 2025
Session freezes and the price data stops
session-freezes-and-the-price-data-stops
February 7, 2025
I can not get past CAPTCHA
i-can-not-get-past-captcha
February 7, 2025
When is support available?
when-is-support-available
February 7, 2025
FTMO Discount
ftmo-discount
February 7, 2025
Unable to access my account
unable-to-access-my-account
February 7, 2025
How to add the Session Indicator?
how-to-add-the-session-indicator
February 7, 2025
How to save my Indicator settings?
how-to-save-my-indicator-settings
February 6, 2025
How to use the Monte Carlo Simulation?
how-to-use-the-monte-carlo-simulation
February 6, 2025
Does FX Replay offer a free trial?
does-fx-replay-offer-a-free-trial
February 6, 2025
What candles does FX Replay offer?
what-candles-does-fx-replay-offer
February 6, 2025
How to use tags when backtesting?
how-to-use-tags-when-backtesting
February 6, 2025
How to create a backtesting session?
how-to-create-a-backtesting-session
February 6, 2025
Am I able to save drawing templates?
am-i-able-to-save-drawing-templates
February 6, 2025
What is the smoothing candle feature?
what-is-the-smoothing-candle-feature
February 6, 2025
How to Take Partial Profits in FX Replay?
how-to-take-partial-profits-in-fx-replay
February 6, 2025
What assets are available for backtesting?
what-assets-are-available-for-backtesting
February 6, 2025
Do charts have AutoSave? My charts are not saving.
do-charts-have-autosave-my-charts-are-not-saving
February 6, 2025
How to separate markings on your charts for different backtesting sessions?
how-to-separate-markings-on-your-charts-for-different-backtesting-sessions
February 6, 2025
What are the trading session hours that FX Replay takes into account for analytics?
what-are-the-trading-session-hours-that-fx-replay-takes-into-account-for-analytics
February 6, 2025
Is it possible to have multiple charts (each with different timeframes or different pairs)?
is-it-possible-to-have-multiple-charts-each-with-different-timeframes-or-different-pairs
February 6, 2025
How far back does the data go? Can I trade the 1m far back?
how-far-back-does-the-data-go-can-i-trade-the-1m-far-back
February 6, 2025
What broker data sources does FX Replay use for its charts?
what-broker-data-sources-does-fx-replay-use-for-its-charts
February 6, 2025
Is it possible to rewind to a specific point in the price chart?
is-it-possible-to-rewind-to-a-specific-point-in-the-price-chart
February 6, 2025
Do you have an affiliate program?
do-you-have-an-affiliate-program
February 6, 2025
How to Cancel My Subscription
how-to-cancel-my-subscription
February 6, 2025
What is your refund/cancellation policy?
what-is-your-refund-policy
February 6, 2025
Available hotkeys for FX Replay
available-hotkeys-for-fx-replay
February 6, 2025
What indicators does FX Replay offer?
what-indicators-does-fx-replay-offer
February 6, 2025
How many devices can I use with FX Replay, and are there any session limits?
how-many-devices-can-i-use-with-fx-replay-and-are-there-any-session-limits
February 6, 2025
Can I add my own custom indicators from TradingView?
can-i-add-my-own-custom-indicators-from-tradingview
February 6, 2025
What payment methods are available?
what-payment-methods-are-available
February 6, 2025
What Are the Differences Between FX Replay Plans and Their Pricing?
what-are-the-differences-between-fx-replay-plans-and-their-pricing
February 6, 2025
Saving a Chart Layout
saving-a-chart-layout
February 6, 2025
Creating Your Checklist in FX Replay
creating-your-checklist-in-fx-replay
February 6, 2025
Configuring Your Trading Strategy
configuring-your-trading-strategy
February 6, 2025
Setting Up Your First Backtesting Session
setting-up-your-first-backtesting-session
February 6, 2025
Exploring the Trader Dashboard: Overview
exploring-the-trader-dashboard-overview
January 6, 2025
Introduction to Forex Backtesting: What You Need to Know
introduction-to-forex-backtesting-what-you-need-to-know-7e087
December 26, 2024
Placing Buy and Sell Orders on FX Replay
placing-buy-and-sell-orders-on-fx-replay
December 26, 2024
Trading on Seconds Timeframes in Forex and Futures Markets
trading-on-seconds-timeframes-in-forex-and-futures-markets
December 17, 2024
Analyzing Your Trades: How to Use the FX Replay Analytics Page
analyzing-your-trades-how-to-use-the-fx-replay-analytics-page
December 17, 2024
Stay Connected with FX Replay on Social Media
stay-connected-with-fx-replay-on-social-media
December 17, 2024
Join our Discord community
join-our-discord-community
December 17, 2024
Basic Troubleshooting
basic-troubleshooting
December 17, 2024
Refund Policy
refund-policy
December 17, 2024
More articles
Configuring Your Trading Strategy
Placing Buy and Sell Orders on FX Replay