
Understanding Your Backtesting Analytics & Key Metrics
Learn where to find Analytics in FX Replay, how to filter and export your results, and what the key backtesting metrics mean.
The Analytics page turns your backtesting trades into performance stats and charts, so you can see what works in your strategy and what to improve. This article explains where to find it, how to filter and export your results, and what the key metrics mean. Prefer to watch? The video above walks through the whole page.
Where to find Analytics
Go to Testing → Analytics (1). Use the filters (2) to choose which trades are included, and the download icon on the right (3) to export your results.

The page has three views at the top:
| View | What it shows |
|---|---|
| Performance | All stats and charts explained in this article. |
| Drawdown | How far price moved against your winning trades (in R) before they closed in profit. See How to Use Drawdown Analytics. |
| Simulation | A Monte Carlo simulation of future results based on your stats. See How to use the Monte Carlo Simulation?. |
Filter your results
All stats and charts update to match the filters you choose. Pick your filters, then click Apply. Active filters are shown as chips under the filter bar; click Clear filters to reset them.
| Filter | What it does |
|---|---|
| Type | Include Backtesting, Battles and/or Prop Firm sessions. |
| Assets | Show only trades on selected assets. |
| Side | Long (buy), short (sell) or both. |
| Outcome | Wins, losses or both. |
| Tags | Show only trades with selected tags. |
| Session | Choose which backtesting sessions to include. |
| Strategy | Show only trades linked to a strategy. |
| Day / Time | Limit results to certain weekdays or hours. |
| Timezone | The time zone used for times, days and trading sessions in your analytics. |
| Backtesting Date | Limit results to a date range on the chart. |
For example, select Side → long only to see how your buy trades perform on their own.
The Timezone filter starts from your Account timezone, which is used across FX Replay. To change it everywhere, go to Account Settings → Account → Account timezone and click Save changes.
Export your analytics
Click the download icon to save your trades as a CSV file. Set the Timezone filter first, since the dates in the file follow it.
Profit and loss
The Profit and loss chart shows how your results grew over time. Switch between All, Day, 1 Hour and 15 Min in the top-right corner. If a trade is still open, you'll see two lines: running P&L (moves with the open trade) and closed P&L (only closed trades).
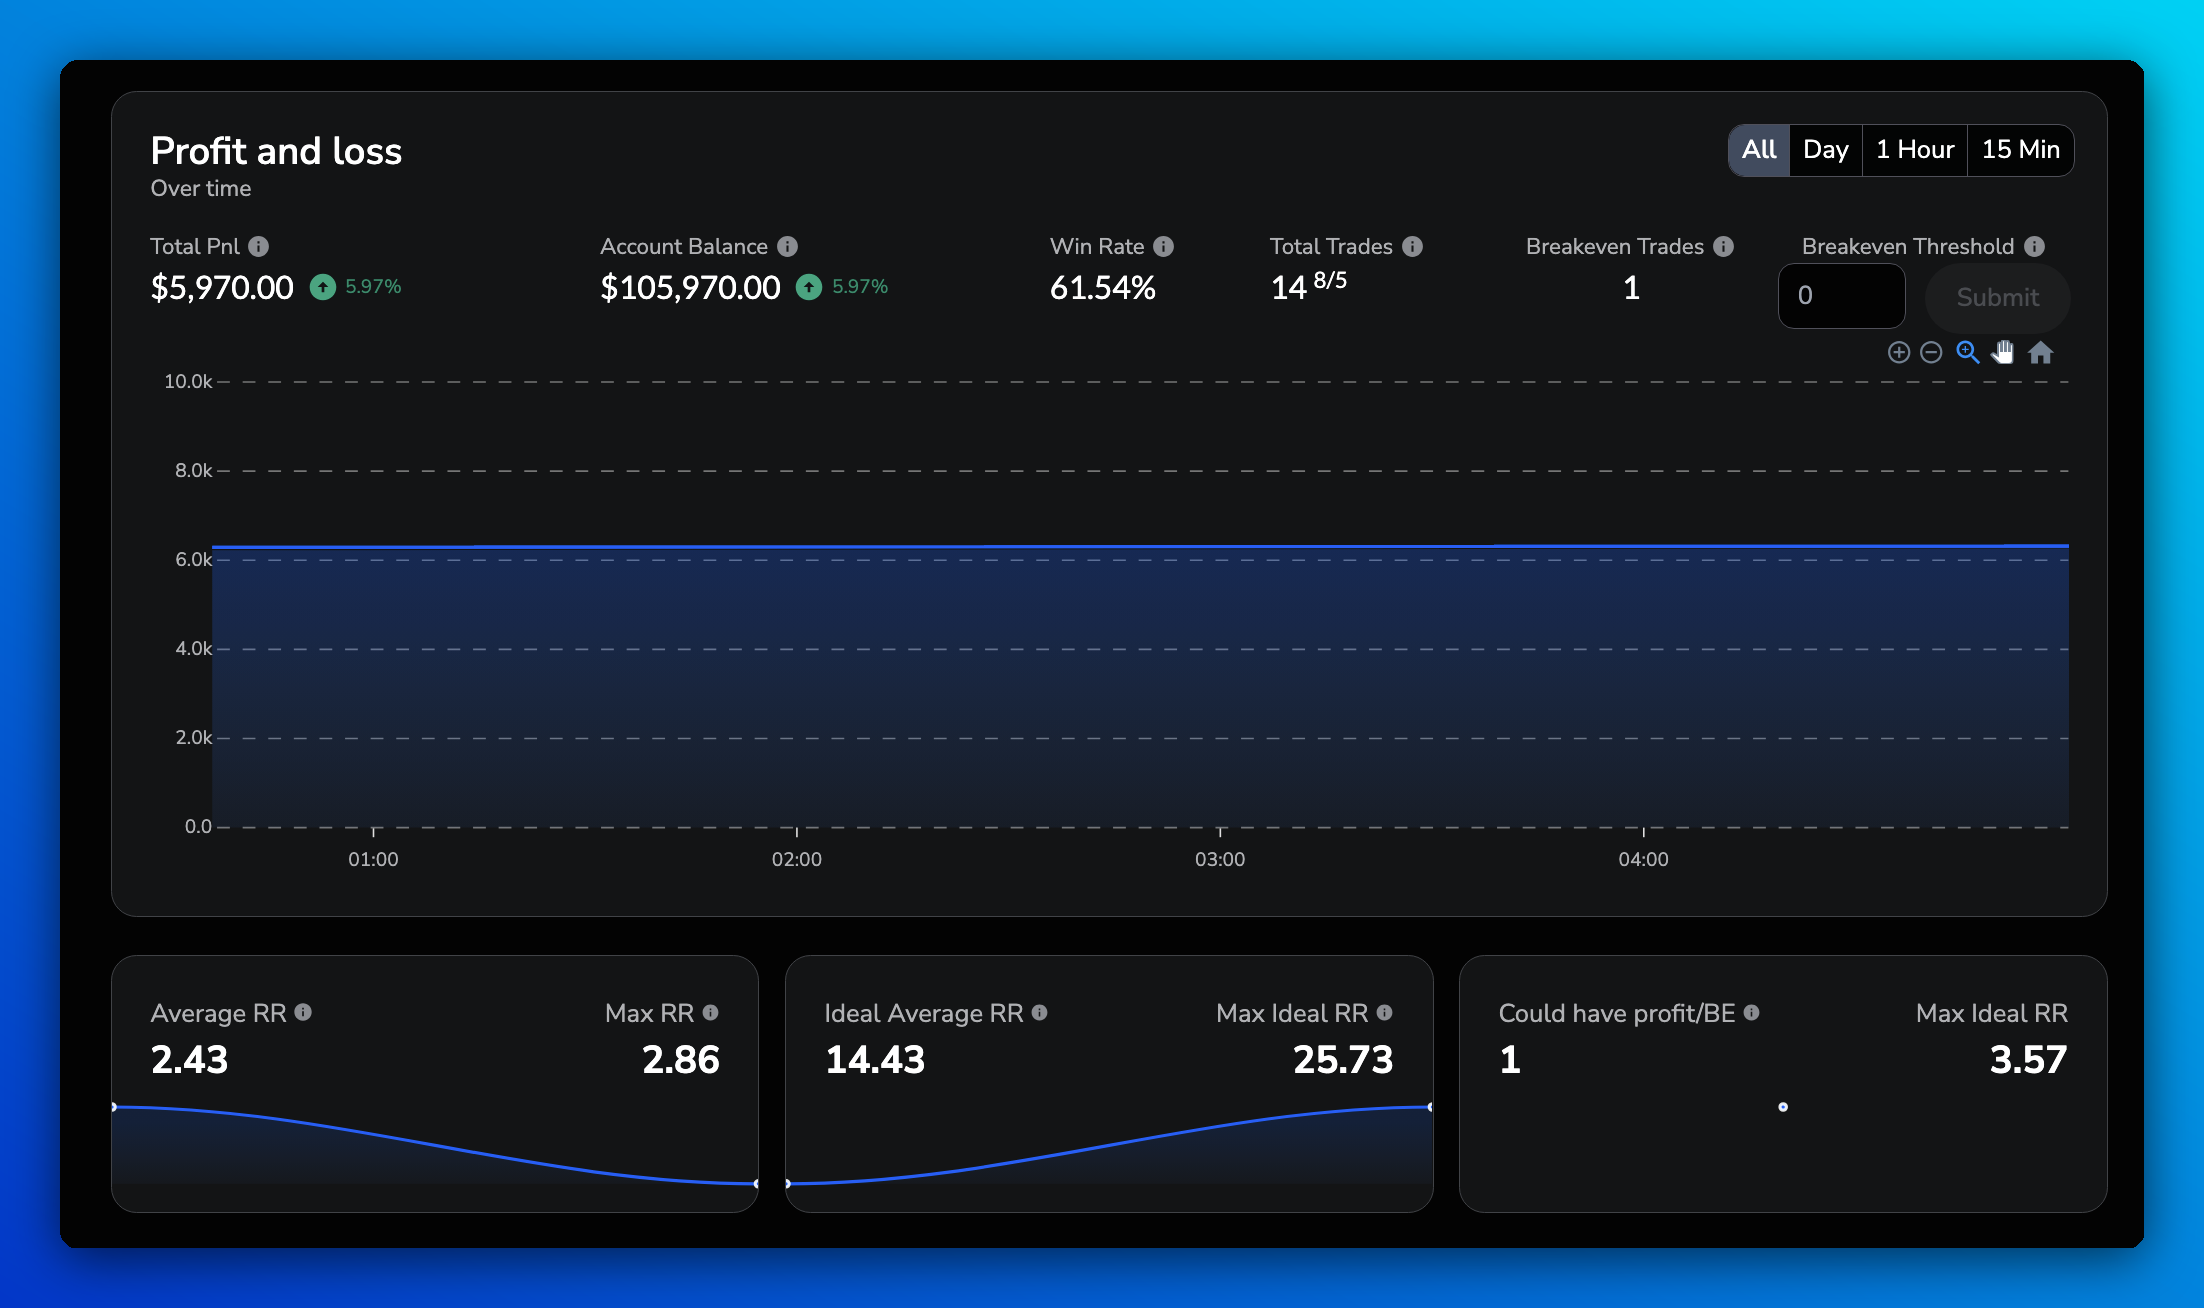
| Metric | What it means |
|---|---|
| Total PnL | Your total profit or loss, in dollars and as a % of your starting balance. |
| Account Balance | Your starting balance plus total P&L. |
| Win Rate | Winning trades ÷ (winning + losing trades). Breakeven trades aren't counted. |
| Total Trades | The big number is all trades. The small numbers next to it are winning / losing trades. |
| Breakeven Trades | Trades that closed at breakeven, based on your Breakeven Threshold. |
| Breakeven Threshold | Enter an R value and click Submit. For example, 0.1 counts every trade that closed between -0.1R and +0.1R as breakeven. |
Risk-reward (RR)
These cards show how much you made compared with how much you risked (your stop loss). They are based on your winning trades.
| Metric | What it means |
|---|---|
| Average RR / Max RR | Your average and highest RR on winning trades. |
| Ideal Average RR / Max Ideal RR | The RR your trades could have reached if held to the best price within one week after closing. A big gap between Average RR and Ideal Average RR may mean you're closing trades too early. |
| Could have profit/BE | Losing trades that were in profit before turning into a loss. These are trades you could have closed in profit or at breakeven. |
Expectancy and profit factor
| Metric | What it means |
|---|---|
| Expectancy | The bar compares your average win (green) with your average loss (red). |
| Profit factor | Gross profit ÷ gross loss. Above 1 means your strategy is profitable; the higher, the better. |
Winners and losers
| Metric | Winners | Losers |
|---|---|---|
| Total | Number of winning trades | Number of losing trades |
| Best win / Worst loss | Your biggest win, as % of balance | Your biggest loss, as % of balance |
| Average win / Average loss | Average % gained on winning trades | Average % lost on losing trades |
| Average duration | How long winning trades stayed open | How long losing trades stayed open |
| Max consecutive | Longest winning streak | Longest losing streak |
| Avg consecutive | Average winning streak | Average losing streak |
Tip: use Max consecutive losses to check your risk per trade. For example, if you risk 1% per trade and your longest losing streak is 5, make sure you're comfortable losing 5% in a row.
Performance breakdowns
Hover over any chart to see the exact values.
| Section | What it shows |
|---|---|
| Performance by side | Total trades and win rate for buy and sell trades. |
| Performance by session | Win rate, total trades, average RR and profit for each trading session. Sessions follow the time zone selected in the Timezone filter. |
| Performance by time | Profit or loss for each hour, based on when the trade was opened. Use the dropdown to switch between Total Profit/Loss, risk-reward and % profit. |
| Performance by day | Profit, loss and win rate for each day of the week, based on when the trade was opened. |
| Performance by month | % gain for each month, plus year to date (YTD) and total. Initial Balance measures each month against your starting balance; Current Balance measures it against the balance at the start of that month (compounding). |
| Average trade frequency | Your average number of trades per day, week and month. |
Performance calendar
The calendar shows your results for each day, with the number of trades. Use the dropdown to switch between Dollar Profit, % Profit and Risk Reward, and switch between Month and Year view. Initial Balance and Current Balance work the same way as in Performance by month.
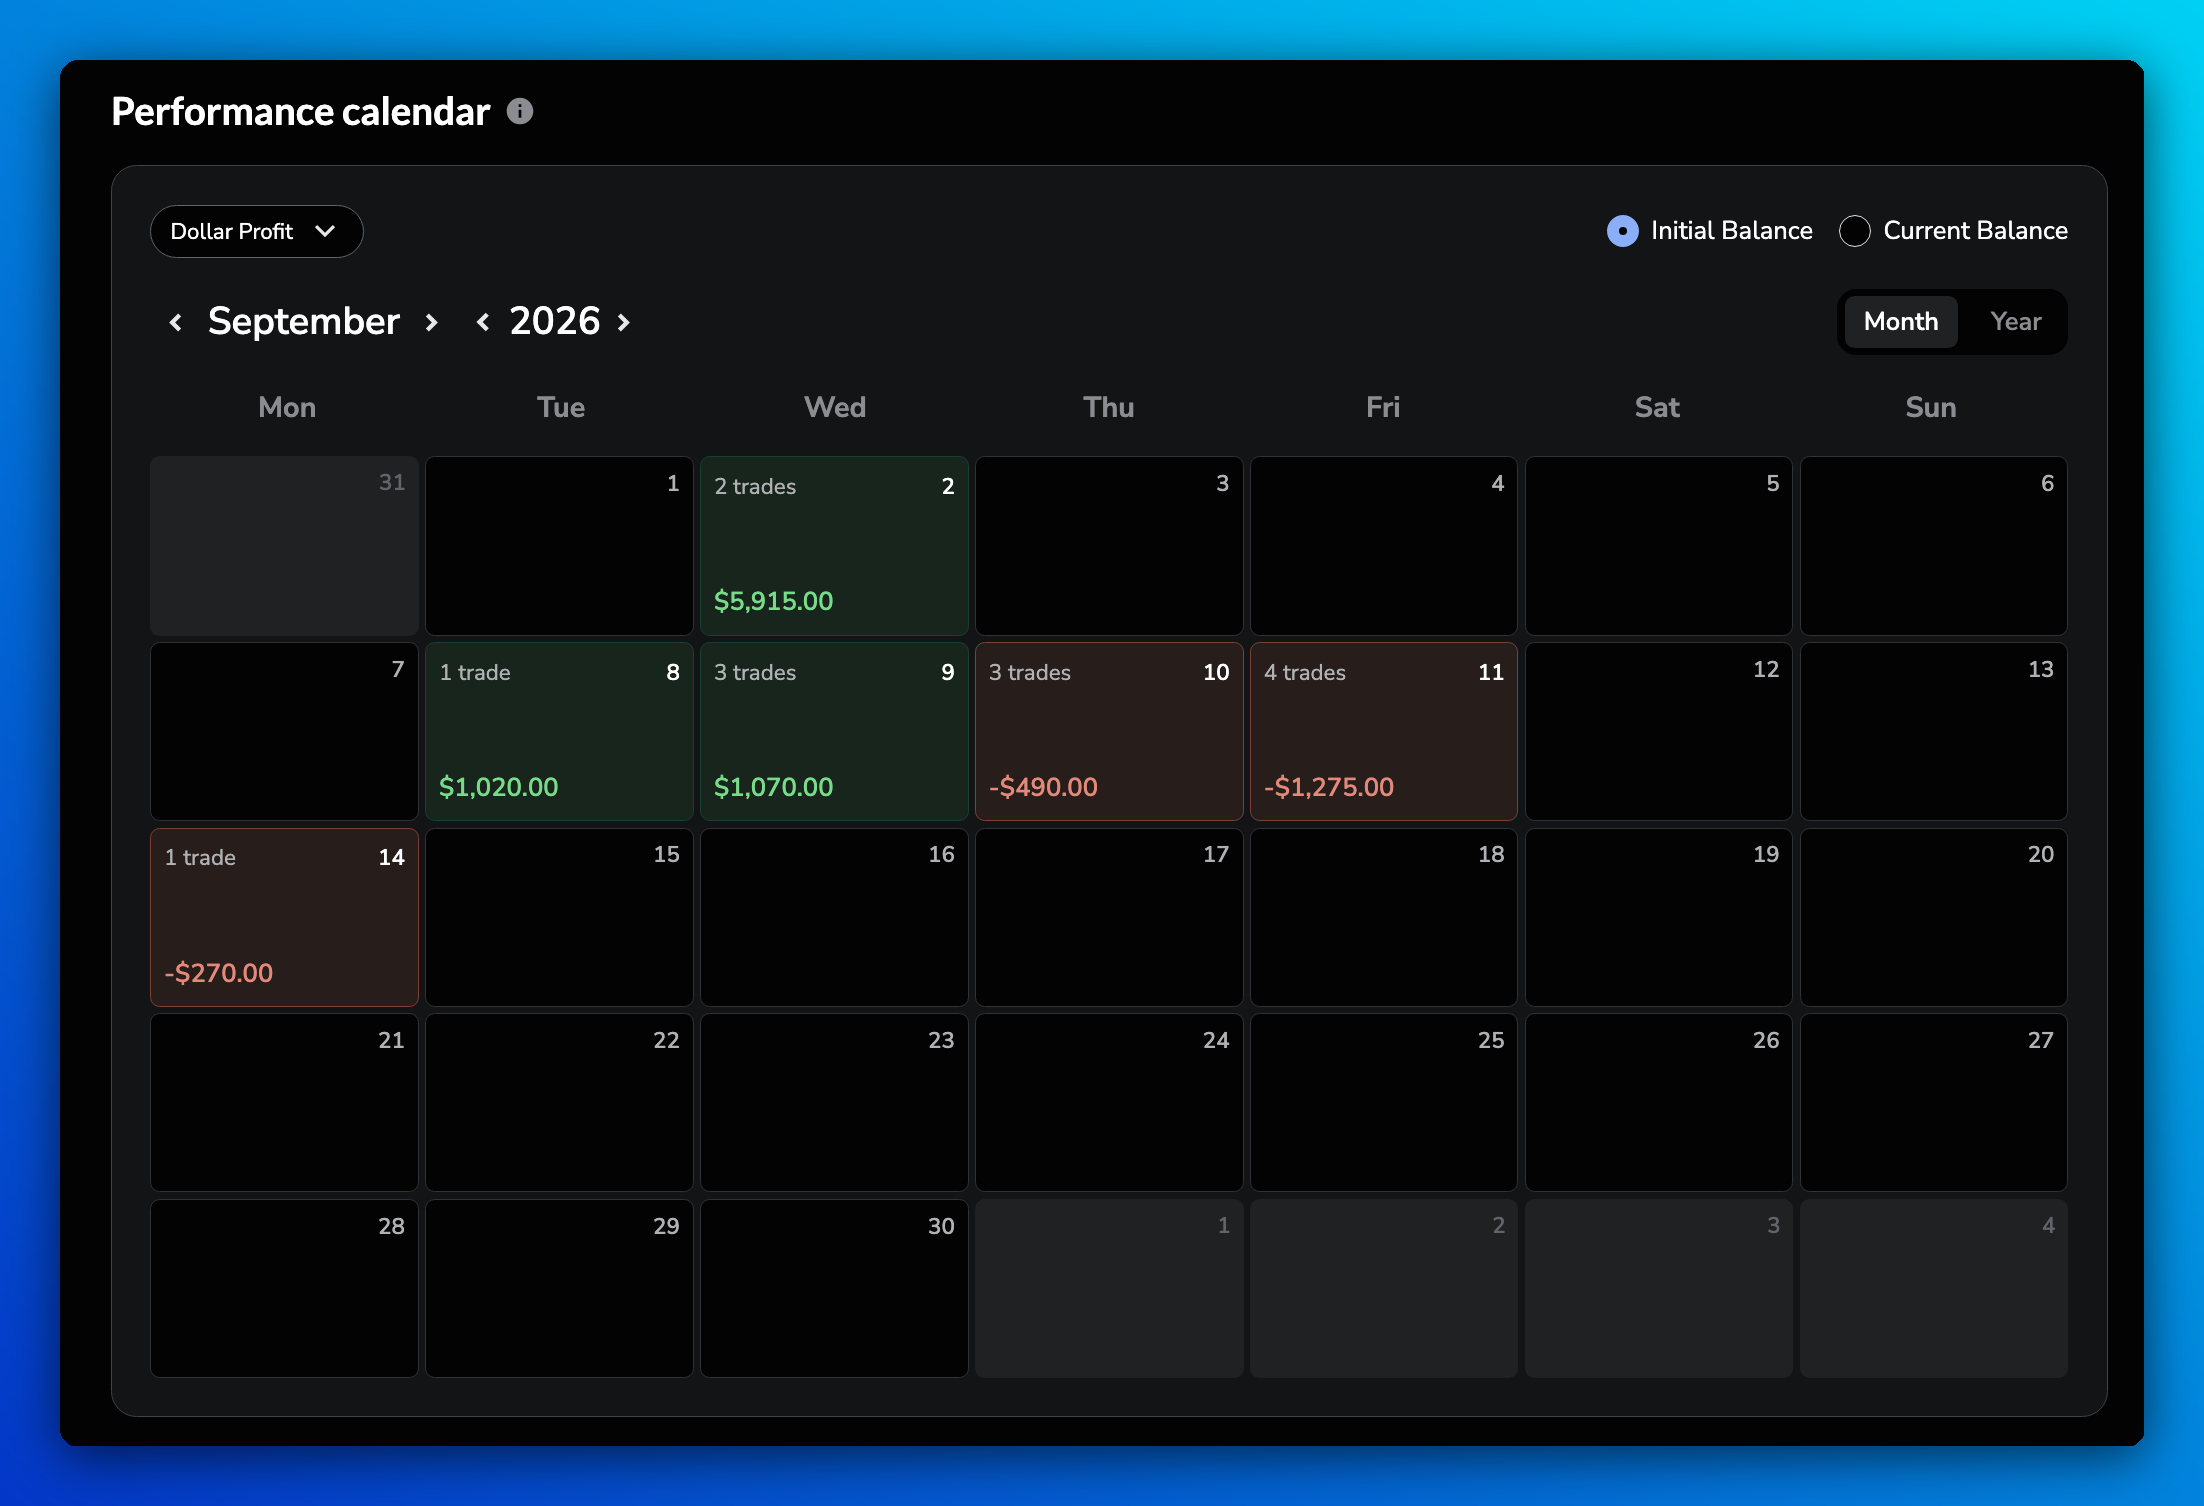
The Risk Reward view includes losing trades (as negative RR), so its values can differ from the RR cards above, which use winning trades only.
What your stats can tell you
- Win rate and RR together: a low win rate can still be profitable if your winners are much bigger than your losers. Check both, along with Profit factor.
- Hours and days to avoid: if certain hours or weekdays keep losing, consider not trading them.
- Consistency: a steady Profit and loss curve shows a consistent strategy. Big drops usually point to trades where you broke your risk rules.
- Enough trades: results from a handful of trades can be misleading. Test a larger sample before drawing conclusions.
Frequently Asked Questions
Why doesn't my win rate include breakeven trades?
Win rate only compares winning and losing trades. Adjust the Breakeven Threshold to decide which small wins or losses count as breakeven.
Why do my sessions, hours or days look wrong?
Check the Timezone filter. Times, days and trading sessions follow the time zone selected there, which starts from your Account timezone in Account Settings → Account.
Can I export my analytics?
Yes. Click the download icon on the Analytics page to save your trades as a CSV file.
Are open trades included?
Yes. While a trade is open, the Profit and loss chart shows a running P&L line next to the closed P&L line.
Why is the RR in the calendar different from Average RR?
Average RR uses winning trades only, while the calendar's Risk Reward view also counts losing trades as negative RR.
Related articles
Keep exploring this topic.