
How to Use the Economic Calendar
Show economic news on your chart in a backtesting session, filter by country and impact, and fix missing news marks.
FX Replay can show economic news events on your chart during a backtesting session. Open News, set your filters, and the matching events appear on the chart.
Open the economic calendar
- Open a backtesting session.
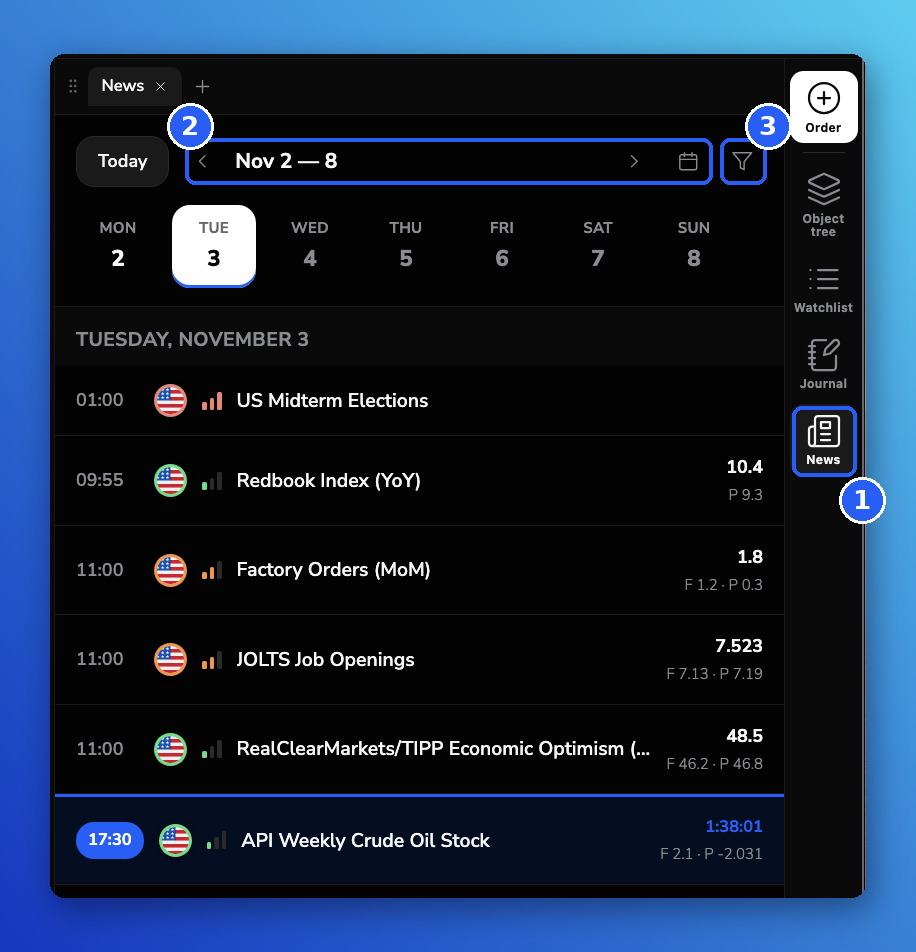
- Click News in the right panel (1). You can also use the shortcut Alt + Shift + E (Windows) or Option + Shift + E (Mac).
The News panel lists the economic events for the selected week. Use the arrows to move between weeks, or click the calendar icon to pick a date (2). Click Today to jump back to the current day. To choose which events appear, click the filter icon (3).
Read an event
| What you see | Meaning |
|---|---|
| Time and flag | When the event is released, and the country it belongs to |
| Bars | Impact level: more filled bars mean a higher impact |
| Large number | The actual result, once it's released |
| F and P | Forecast and previous value |
| Blue time and countdown | The next event coming up, and the time left until it's released |
Choose which events to show
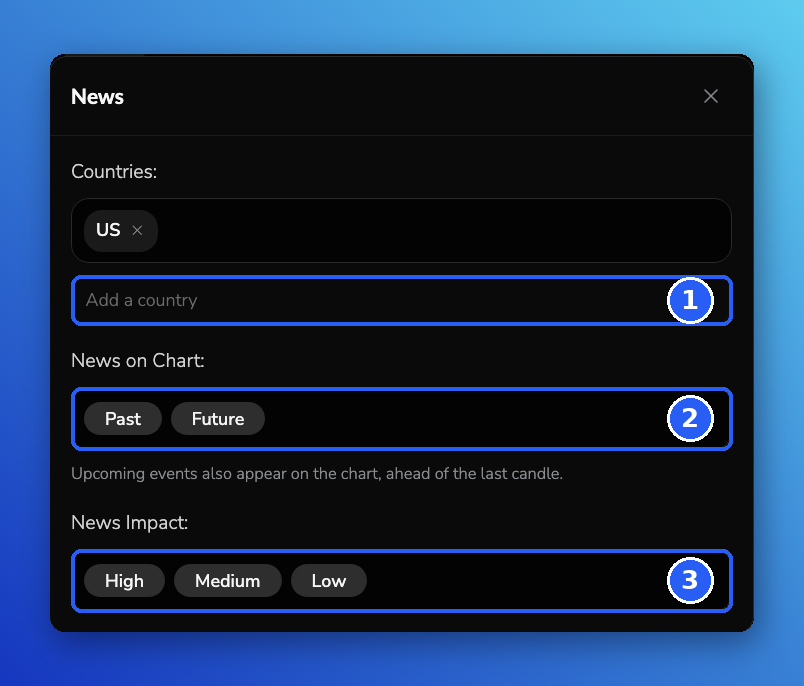
Click the filter icon in the News panel, then fill in each section:
- Countries (1): type in Add a country to add one. Click × on a country to remove it.
- News on Chart (2): choose Past, Future or both. Upcoming events also appear on the chart, ahead of the last candle.
- News Impact (3): choose High, Medium, Low, or any combination.
Events that match your filters appear in the News panel and on the chart.
If news does not show on the chart
If your filters look right but no news marks appear:
- Right-click the chart.
- Check that Hide marks on bars is off.
When Hide marks on bars is on, news marks stay hidden even if News is open and filtered.
Frequently Asked Questions
Where is News on the New Chart?
In the right panel with Order, Object tree, Watchlist and Journal. See The New Chart: What's Changed and Where to Find Everything.
News is open, but I still see no events on the chart. What should I check?
Check your filters: countries, Past or Future under News on Chart, and impact. Then right-click the chart and make sure Hide marks on bars is off.
Related articles
Keep exploring this topic.